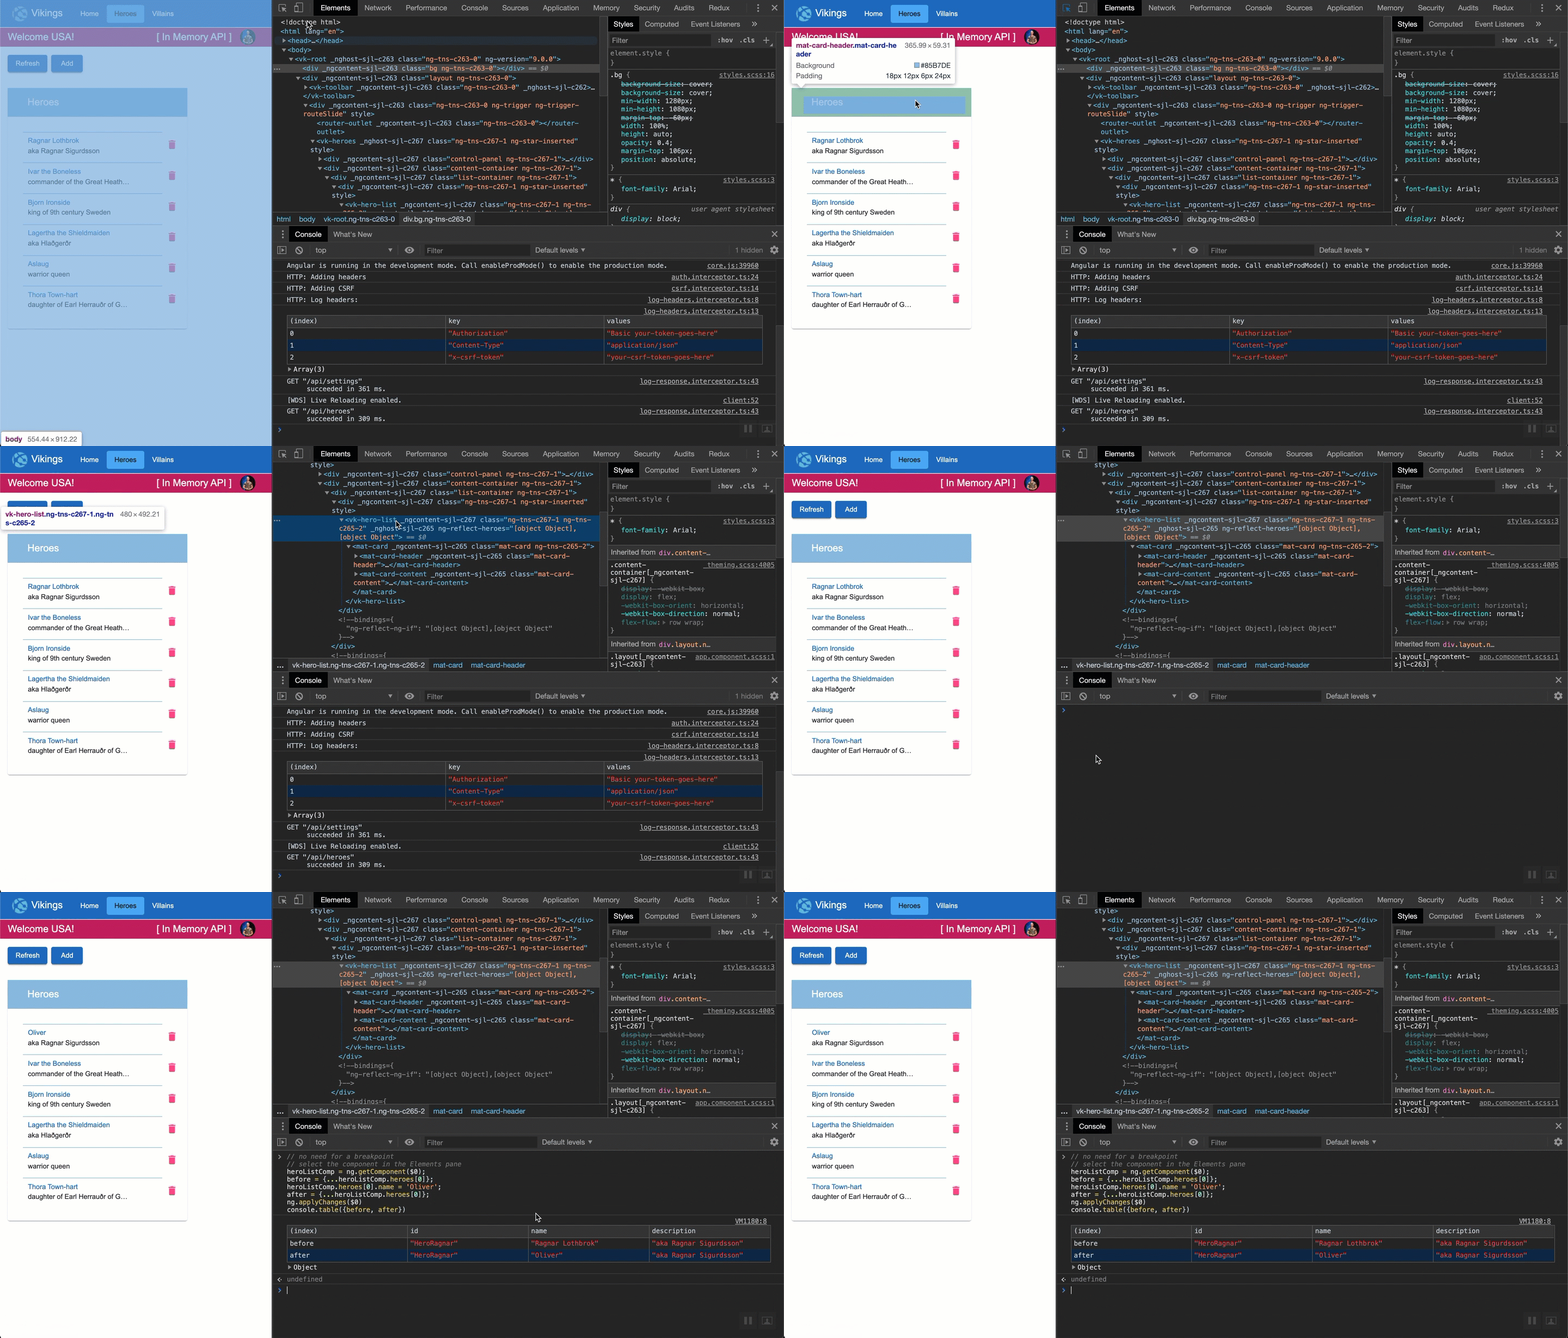
The Angular 9 Ivy runtime offers a new ng object for debugging Angular apps, when you run in Dev mode.
Let's get an idea of what you can do.

This GIF shows the following steps:
- Run your Angular 9 app
- Open the Chrome developer tools
- Select the component's element
- Type the following code in your console
Note that my angular app has a component with an array of heroes. Each hero has a name and a description. Change the code below to reflect your app.
// get the component you selected in the Elements panel
heroListComp = ng.getComponent($0);

// Clone the first hero
before = {...heroListComp.heroes[0]};

// Change the first hero's name
heroListComp.heroes[0].name = 'Oliver';

// Clone the first hero, after your changes
after = {...heroListComp.heroes[0]};

// Display the before and after
console.table({before, after})

// Apply the changes (so you can see them in the View)
ng.applyChanges($0)
Note that we are using a few of the ng features here. the ng.getComponent() function gets the component associated with the element. This works for us here because we passed an element that is a component. It would return null if the element is not a component (like a div). The next article in this series will show some other techniques to get a component.
We also use the ng.applyChanges() function to tell Angular's change detection to run.
Learn More
Pretty cool! This is just one of the new features in Angular 9. To learn more, check out this article on 7 new features in Angular 9.
You can grab these great new Angular 9 tools here, too
- VS Code editor
- Angular Essentials Extension for VS Code
- Angular Language Service for VS Code


